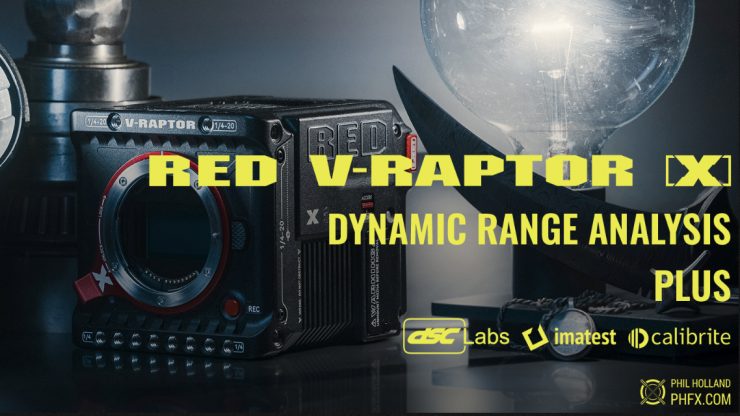
Phil Holland reached out to me to share his RED V-Raptor [X] Dynamic Range Analysis Plus paper that he has just released and gave us permission to publish on the site. The paper takes an in depth look at dynamic range, latitude, image noise, etc.
Now, these are Phil’s independent tests and not ours, so I can’t verify any of this information, but it certainly gives you a comprehensive look into the performance of RED’s latest camera.
Phil spent 3 weeks conducting in depth technical and real world tests. He has provided this as a resource to illustrate important aspects of doing technical tests such as these while also highlighting how he derives his total captured dynamic range assessment. There is a lot of work and effort required to do these tests. Phil has 25+ years of experience testing image acquisition systems professionally, and this is the first time he has ever publicly published such an in depth look.
I am going to just show you some of his findings. To see the complete test and all of the data head over to his website.
What Phil is testing is Total Captured Dynamic Range, Latitude, and Signal-to-Noise Ratio.
Total Captured Dynamic Range (TCDR) describes the amount of information an imaging system can capture from the darkest shadows that descend into the Noise Floor through the brightest highlights that Clip into pure white. I am measuring and displaying these results in t/stops as that has my practical relevance for cinematographers which can be used for predictable results.
Outside of pure tonal informaton, Dynamic Range has a relationship between the quality and ht amount of color information that can be captured and reproduced as well. When I assess a cam- om era’s capabilities I focus on a fully well exposed image from the brightest highlight with all three. channels of color information exposed down to the darkest black that rolls into the Noise Floor, I also test Overexposure and Underexposure as they can provide additional useful information for making an image.
Latitude refers to the malleability of the captured image when pushing or pulling the exposure. This is very much tied to the full ISO Range of the camera, and perhaps a bit beyond recommend ed practices in extreme circumstances. This gets most interesting when the image is stressed and poorly exposed as you can see where things faill apart, but in the same breath, also reveals a lot about the workable range of the image.
Signal-to-Noise Ratio (SNR) is the relationship between the signal and image noise. This is not the Total Captured Dynamic Range, but rather how clean or noisy those stops are. A lower measured value means more noise, higher number means less noise.
Many put high value in knowing specifically SNR1 and SNR2, which I will show in my results here. I have some grounded thoughts about SNR as it is perhaps the most impacted measurement across various cameras that have in-camera Digital Signal Processors that also perform different methods of Noise Reduction. Additionally, post production techniques used to add or remove image noise come into play as well as downscaling having a possible beneficial influence on SNR.
Everything Phil tested here has been captured in REDCODE RAW, and ideally it’s a minimally mangled RAW image for maximum flexibility and image quality.
Testing Tools & Methods
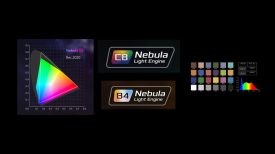
Phil was using one of the industry’s standard DSC Labs Xyla 21 charts and the results he shows are with and without the included Shutters to provide a real world and “perfect lens” measurement. He was also be using IMATEST Master to measure the chart, which is useful for consistent measurement and ease of entry for those who aren’t code savy. Phil also uses and shows various Calibrite Charts, which are useful during capture and in post production.
You’ll see various repeatable exposure tests ranging from well exposed to fully overexposed as well as underexposed.
All tests were done in a dedicated large office room that was blacked out for technical tests. It’s a zero lux environment with dark walls. Phil verify his Xyla via densitiometer to ensure 0.3 Density or 1 f/stop increments prior to testing.
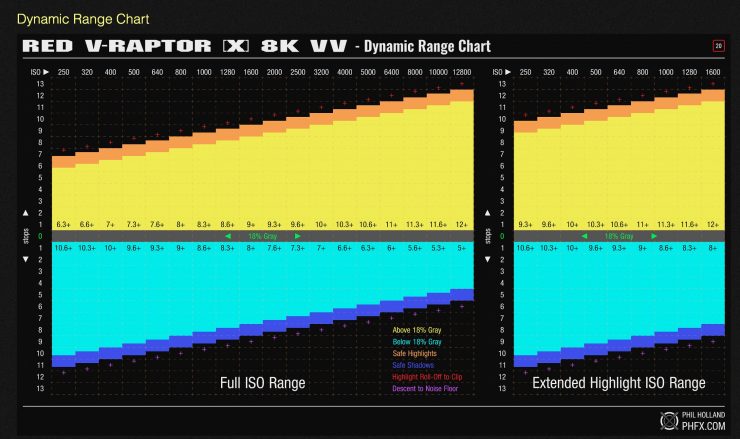
It is critical to test the Full ISO Range of a digital cinema camera. To draw an analogy, it would be like thinking The Matrix is a film about working a desk job rather than having the full story if you don’t inspect the whole range.
What Phil is testing here is Total Captured Dynamic Range, Latitude, and Signal-to-Noise Ratio Total Captured Dynamic Range (TCDR), which describes the amount of information an imaging system can capture from the darkest shadows that descend into the Noise Floor through the brightest highlights that Clip into pure white. He measures and displaying these results in f/stops as that has practical relevance for cinematographers which can be used for predictable results.
It’s also important to utilize the Xyla 21 or 26 included Shutters as the impact of lens flare will skew camera measurements and actually be more about a camera + lens measurement otherwise. Outside of pure tonal informaton, Dynamic Range has a relationship between the quality and amount of color information that can be captured and reproduced as well. When Phil assess a camera’s capabilities, he focuses on a fully well exposed image from the brightest highlight with all three channels of color information exposed down to the darkest black that rolls into the Noise Floor. He also tests Overexposure and Underexposure as they can provide additional useful information for making an image.
Testing Methods and Margin for Error or Variance
When Phil inspects Dynamic Range he uses multiple lenses and compares them against re-ran tests (passes). In this case he tested 6X lenses with 3X passes each with 5X samples from each image sequence to account for Random Image Noise.
TEST 1 – Total Captured Dynamic Range – RGB Exposed – No Clipping/No Overexposure
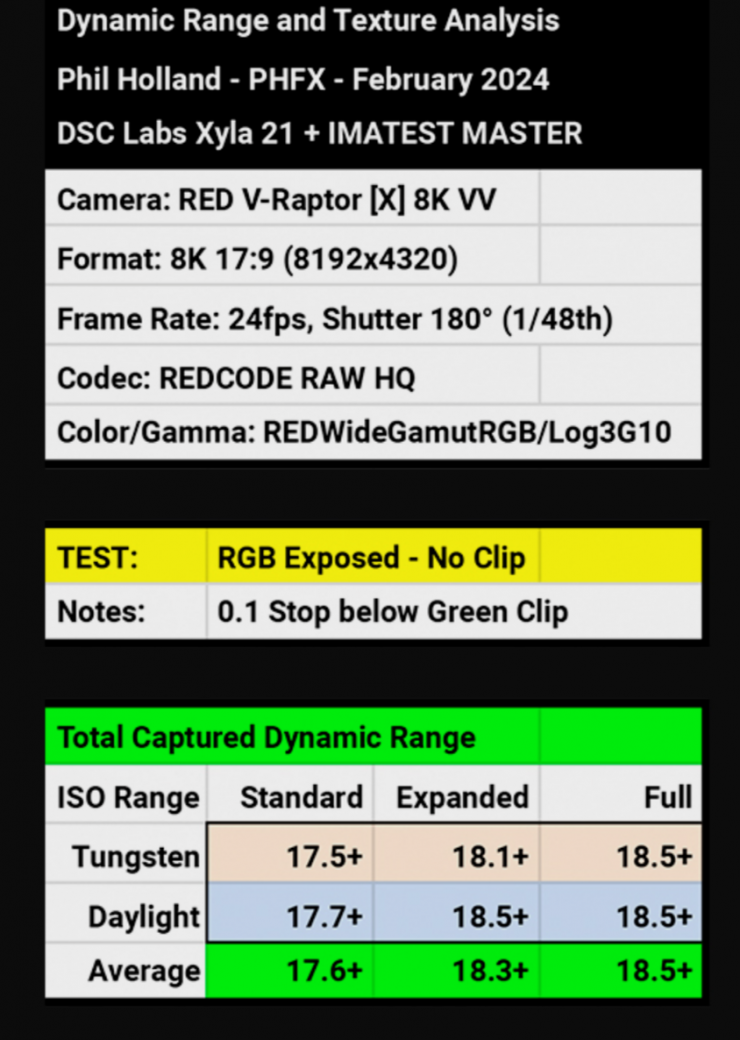
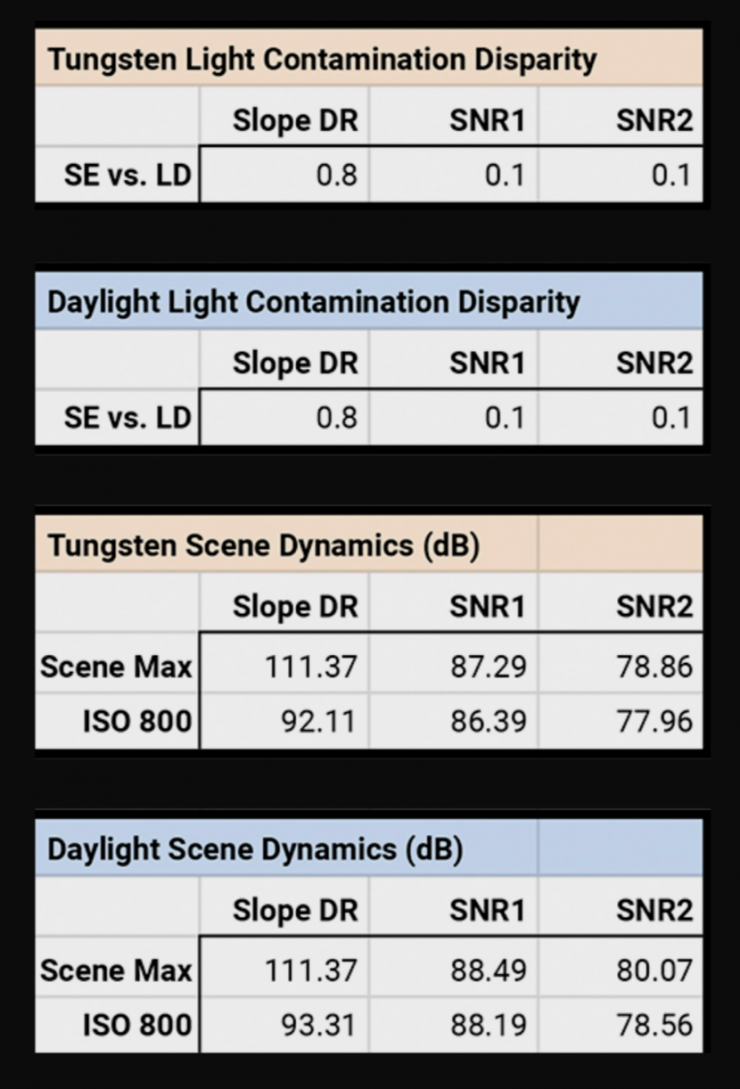
Exposure is captured exactly 0.1 stop before the Green Channel Clips. This test reveals the Total Captured Dynamic Range with both color and luminance fully exposed for both Tungsten and Daylight sources. Single Exposure is a practical reference, but in effect is providing the measurement for a given lens at a specific T-Stop, with the influence of Lens Flare. The difference can be seen in the Light Contamination Disparity. Light and Dark Slides are a composite using the Xyla Shutters and removes the influence of lens flare which more accurately measures the potential of the camera sensor itself. This also has broader ramifications when exposing for scenes that are less dynamic, which makes the measurement a bit more fluid than you’d imagine.
This test is where Phil assess and provide his rating for Total Captured Dynamic Range of a camera system as the image is well exposed. In this case, Phil states that confirming 17+ Stops is a fairly straight forward conclusion.
If you take a look at the Four Dynamic Range Tests, Phil performs various tests using emissive charts like the DSC Labs Xyla 21. He will be focusing on the 4 most important to investigate Dynamic Range.
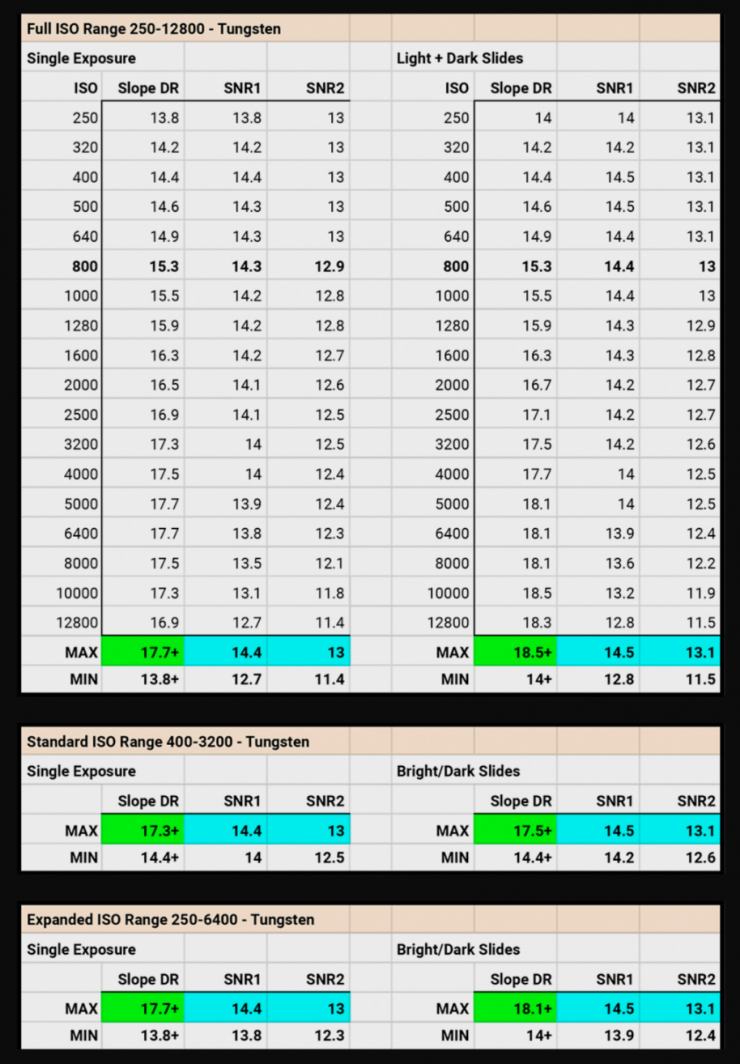
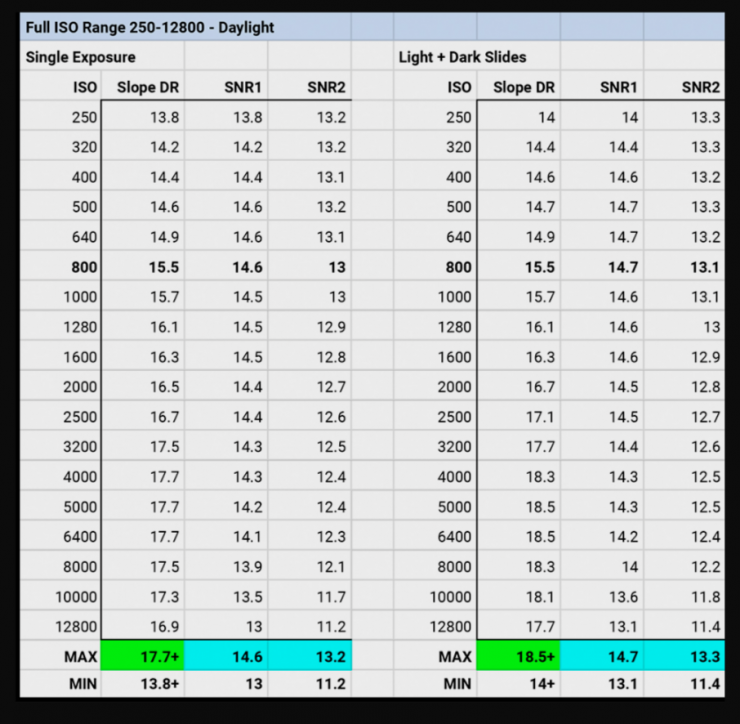
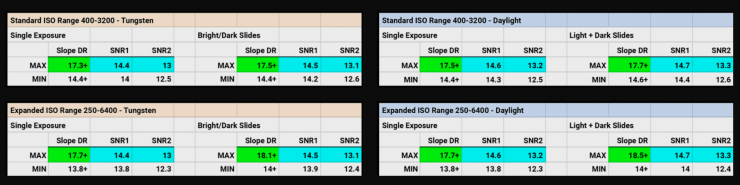
Phil is looking at two of the ISO Ratings that provided some of the best measurements for each test here, but as you’ll see, he tests the Full ISO Range as well. Additionally, he tests the Xyla at native Tungsten (shown here) and Daylight Color Temperature as some sensors perform differently depending on a variety of factors.
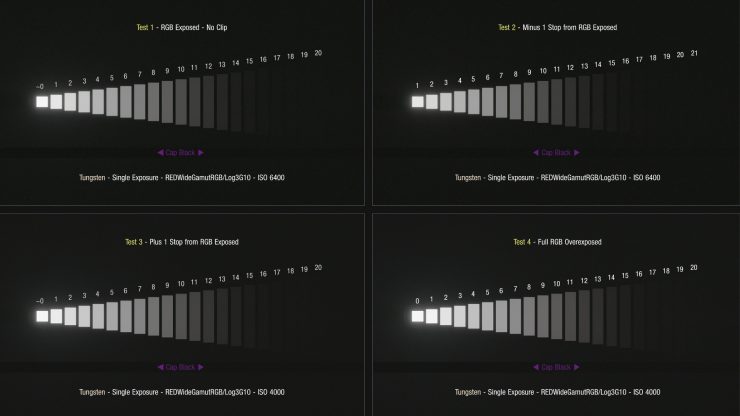
Test 1 is a full RGB Exposed image, right to the edge of exposure. This is typically where Phil derives his assessment for Total Captured Dynamic Range.
Test 2 is Minus 1 Stop from RGB Exposed, which Phil finds is a safer more practical real world way of maintaining rich highlight detail and color if desired.
Test 3 is Plus 1 Stop from RGB Exposed, which is a semi-common real world overexposure situation.
Test 4 is Full RGB Overexposure, all channels clipping, which is the maximum of what to expect from ceiling to floor. This is also a fairly standard measurement for Maximum Dynamic Range.
You will see black horizontal bars over the Xyla charts here. This is “Cap Black”, which highlights the need to use the Shutters included with the Xyla charts to eliminate light contamination from our measurements. We are measuring the sensor here and not the lens + sensor. Both measurements are useful, however, Phil will be providing data from both Single Exposure as well as Light + Dark Slides.
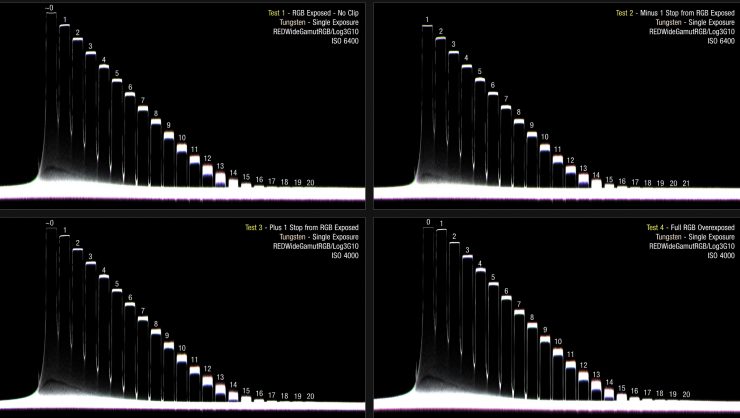
Above are the waveforms for the 4 Xyla 21 Tests, for brevity, all Tungsten. Phil has created a 3 frame average for ease of viewing the tonal steps and also this is somewhat similar to how IMATEST Master “sees”. Additionally, consider a 3 frame average a decent temporal concept for how this ap- pears in motion when inspecting Random Image Noise and identifiable stops.
Test 1 RGB Exposed IMATEST reports 17.7 stops at ISO 6400. The Green Channel is “just” exposed, 0.1 stop from clipping.
Test 2 Minus 1 Stop from RGB Exposed IMATEST reports 17.3 stops at ISO 6400 and we can see tonal separation on this very well exposed image confirming that.
Test 3 Plus 1 Stop from RGB Exposed IMATEST reports 17.7 stops at ISO 4000. Here for our Tungsten X21 Chart the Green Channel is clipping with RED’s IPP2 Color Science doing some work to retain the rest of the color and luminance detail.
Test 4 Full RGB Overexposure IMATEST reports 19.3 stops at ISO 4000. All Channels are Clipped, but again, RED’s IPP2 Color Science is doing what it can to retain as much color and luminance information. Additionally, this is a brighter exposure, which will show more shadow stops above the Noise Floor than say Test 02.
There is a vague term some use, “usable stops”, that I Phil is personally strongly against as it is not defined. But across the tests we have a decent 17 and 18 stop separation that would be visible tonality. At lower ISO Ratings, this would be less apparent however, emphasizing why it’s important to test the Full ISO Range,
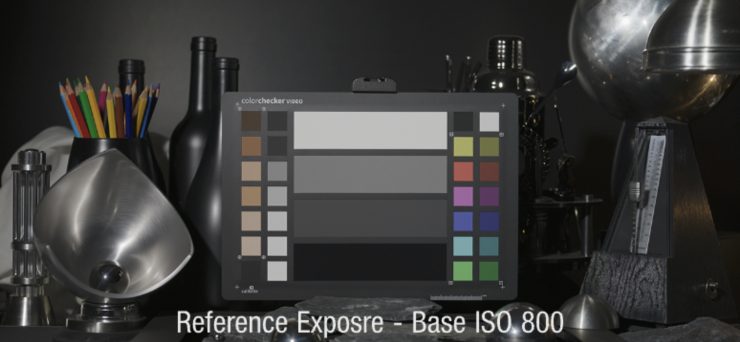
Test6: Latitude & Color Stability- Underexposure
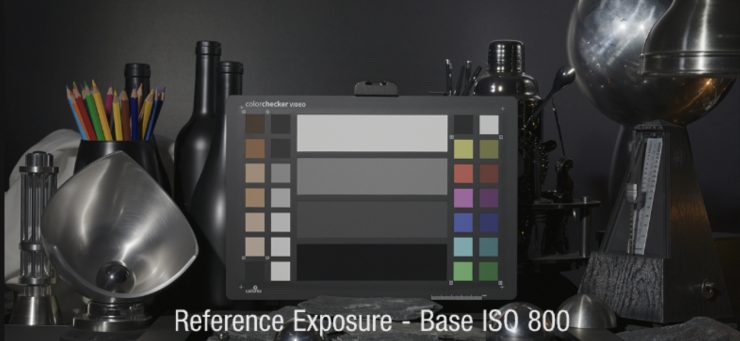

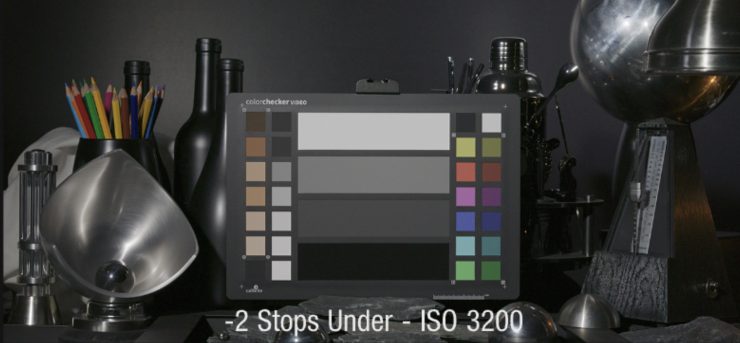
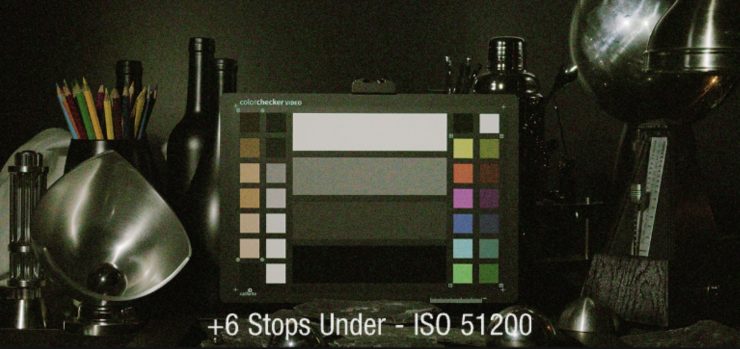
At the Base ISO of 800 this dynamic test scene does indeed have small portions of the image crushing into the noise floor. Fully intentional as this is a controlled stress test. We are exposed 18% Gray which can be seen on our Calibrite ColorChecker Chart.
Observational Notes
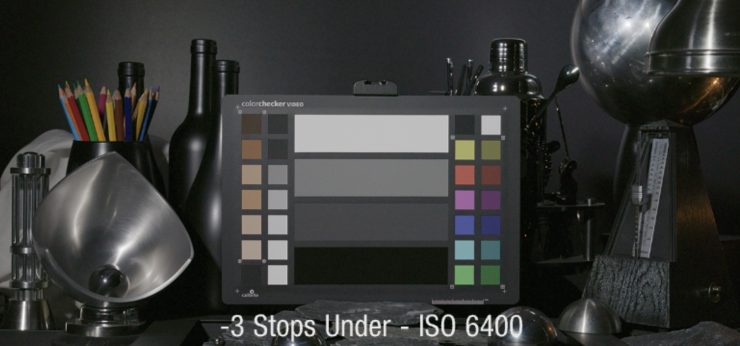
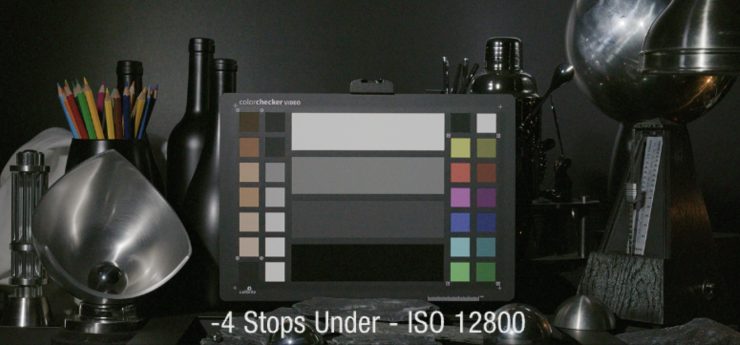
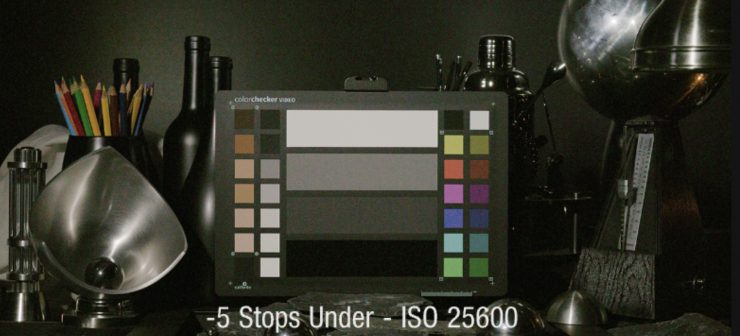
The image holds extremely well at -3 Stops Under with a predictable increase in image noise. It is particularly good at -2 stops. At -3 stops, noise is apparent, but reasonable and expected. At -4 Stops Under Visual Noise is very present, but Color Information is well retained with subtle shadow color shift/tint. At -5 and -6 Stops Under we are well outside of the Camera’s ISO Range. Visual Noise is very evident as well as some color shift in the shadows. However, what is remarkable is color saturation is holding well into underexposure. This alludes to minimal, if any, in camera image processing allowing for a very underexposed image having recoverable color and detail information via Post Processing. This highlights some of the benefits of having RAW image data.
Image Making Notes
Underexposing beyond 2 stops would be uncommon unless in extreme low light conditions. Underexposing 3 or 4 stops provides an image that is very workable with increased image noise. producing a lower (worse) SNR value/measurement. The RED V-Raptor [X] maintains a fairly low noise image up until about-2 Stops Under at ISO 3200. Beyond that point, Image Noise will have more presence in your frame. In practice with basic temporal noise reduction you can improve the SNR by about 1 stop and with advanced noise reduction techniques up to 2-3 stops as of this moment in 2024. For Phil, -4 stops is the workable latitude from ISO 800 with -3 being what he would consider safe.
Test7: Latitude & Color Stability- Overexposure
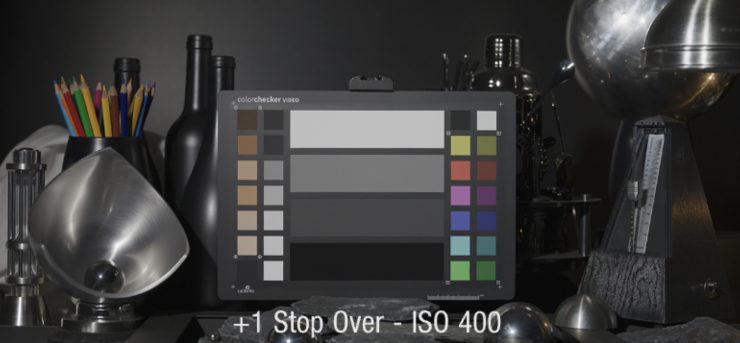

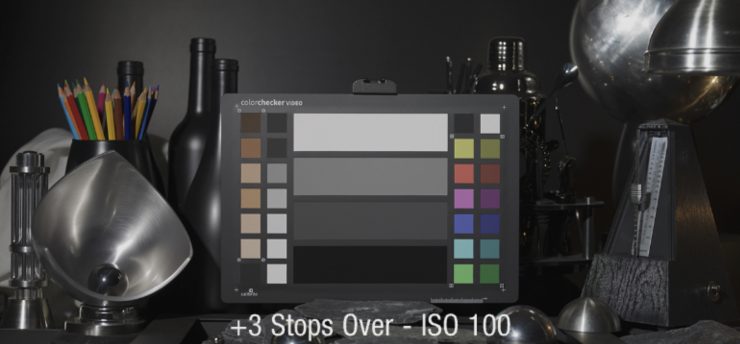
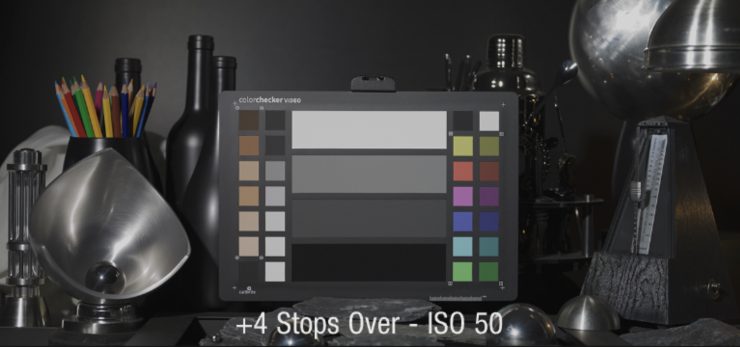
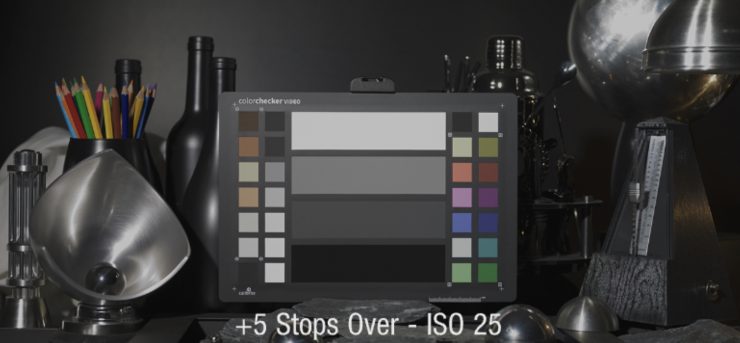
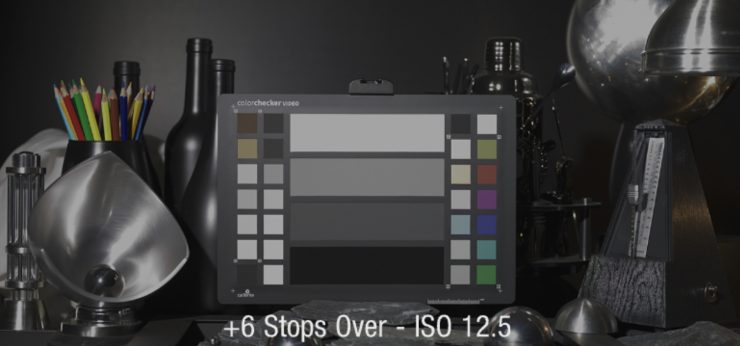
At the Recommended Base ISO of 800 this dynamic test scene does indeed have very small portions of the image overexposing. Small specular highlights are clipping on shiny objects. Once again, fully intentional as this is a stress test. We are exposed for 18% Gray which matches our reference on the Calibrite ColorChecker Chart.
Observational Notes
The Image holds extremely well at +3 to +4 Stops Overexposed. It does lose some highlight definition at +3 and +4 stops in the hottest specular highlights, but it maintains good saturation even outside the Full ISO Range of the camera. At +5 Stops Overexposed we can see we are losing even more in the highlights, but tone reproduction for most of the frame is there. But, we are beginning to see the effects of Overexposure on the color chart. We are losing a bit of saturation and certainly detal in the highlights at this point. At+6 Stops Overexposed we are losing a significant portion of luminance information as well as a fair bit of color saturation. In a less dynamic exposure, lower contrast scene, potentially workable.
Image Making Notes
In practice most would not overexpose beyond 2 or 3 stops and certainly not without being aware of it via the Exposure Monitoring Tools. For Phil, a pleasing Highlight Roll-Off is there up to +3 to +4 stops in an exposure with a small impact on specular clipped highlights, +4 stops holds very well across the majority of the image.
Interestingly, REDCODE RAW via the metadata controls allows you to go to ISO 50 and perhaps reveals why. Considering common levels of light intensity and lower contrast exposures. this is a very good working range,
For Phil, +3 or +4 stops is the workable latitude from ISO 800, likely leaning into +3 as safe.
Phil’s Conclusion & Takeaways
Firstly, I’m hoping to hammer some key points down here for everybody in regards to the fluidity of Dynamic Range measurements. Typically Dynamic Range is measured from a fully Exposed (no clipping) or fully Overexposed (full clipping) image, and both are clearly worth knowing. In this case, even when underexposed by one stop, we are still getting 17+ Stops of Total Captured Dynamic Range. And hopefully this illustrates clearly how RED is using that Dynamic Range in their sensitivity weighting/distribution, calibration, and ISO Range.
I think objectively I can say RED V-Raptor [X] does perform ever so slightly better with a Daylight source, particularly at higher ISO Ratings. More importantly though, via other color tests, Tungsten is producing nice and smooth skintones without issues I’ve uncovered on other cameras. And I can confirm the images are impressively clean with both Tungsten and Daylight at pretty high ISO Ratings. Additionally, the performance and Latitude deep into the shadows is very, very good. In fact, I didn’t measure any shift due to Infrared Contamination either in deep shadows. Across the in-camera ISO Range, Color Stability and Latitude is also excellent and reveals a lot about the power of RAW image data if you find yourself looking for more image information in post. I do occasionaly enjoy a fairly bold color workup and I can push this material around a lot without issue. To hit that home further, this is a “thick” image maker.
With these tests I’m showing both real world measurements with the Single Exposure and a proper sensor measurement once you attend to Lens Flare and light contamination using the correct testing procedures with our Dark and Light Slides samples. I think it’s clear now why it’s important to test the entire ISO Range as well.
What would be a next logical step is to test either a Monochrome version of this camera or test- ing the sensor without a Color Filter Array as well as the Color Science Filter stack to really get to the bottom of just how much the sensor can see, but that is outside of how this particularly camera model will be used. The sensor itself is tremendously sensitive and is very high dynamic range, which is a technological accomplishment for a Global Shutter Sensor design. Personally, I’m extremely impressed by that as not long ago this really wasn’t possible.
And how about compared to the V-Raptor 8K VW with rolling shutter? Nearly identical performance across the board when it comes to measuring the dynamic range and image noise. What’s most interesting is the improved optical path of V-Raptor [X] 8K W. Less stray light in testing and ever so slightly deeper black point. In real world images they match very well, but it was eye opening to see extremely subtle differences when A/B’ing the two.
I do hope you’ve enjoyed this more detailed look into some of my tests, thoughts on best practices, and some additional notes. I like applying these tests to the way I work, and ideally you can see how to achieve that as well. It’s my goal that this information is most useful for filmmakers of all types and certainly those who are dabbling in a deeper understanding of what these tools can do. For professional cinematographers our unique mastery over exposure, lighting, color, tone, and mood with intention is a major part of what we do. Discovering how our tools can best help us make our vision reality is truly what this is all about.
My thoughts
Lots of people test cameras in a variety of different ways and while technical testing is certainly important it can only ever tell you part of the story. Numbers and figures are all good and well, but the best way to put any camera you are interested in to the test is by shooting real world footage in conditions that you plan on using a camera in.
I think different forms of dynamic range testing are all relevant as long as the tests are all done in the same exact way. As long as the parameters are exactly the same for how you do it, they at least give you a baseline where comparisons can be made.
It is interesting to see how Phil tests cameras and the methodoligy he uses for doing so.
I am sure Phil would be more than happy to answer any questions about these tests that any of our readers may have in the comments section below.